Tracking What Matters: RevOps Metrics for Performance and Growth
RevOps Metrics That Actually Matter
Last updated: June 1, 2026
Quick answer
The best RevOps metrics connect daily GTM activity to revenue outcomes.
Most teams track dashboards, pipeline, forecasts, and reports, but still struggle to explain why they missed target. The problem is usually not the dashboard. The problem is the metrics structure.
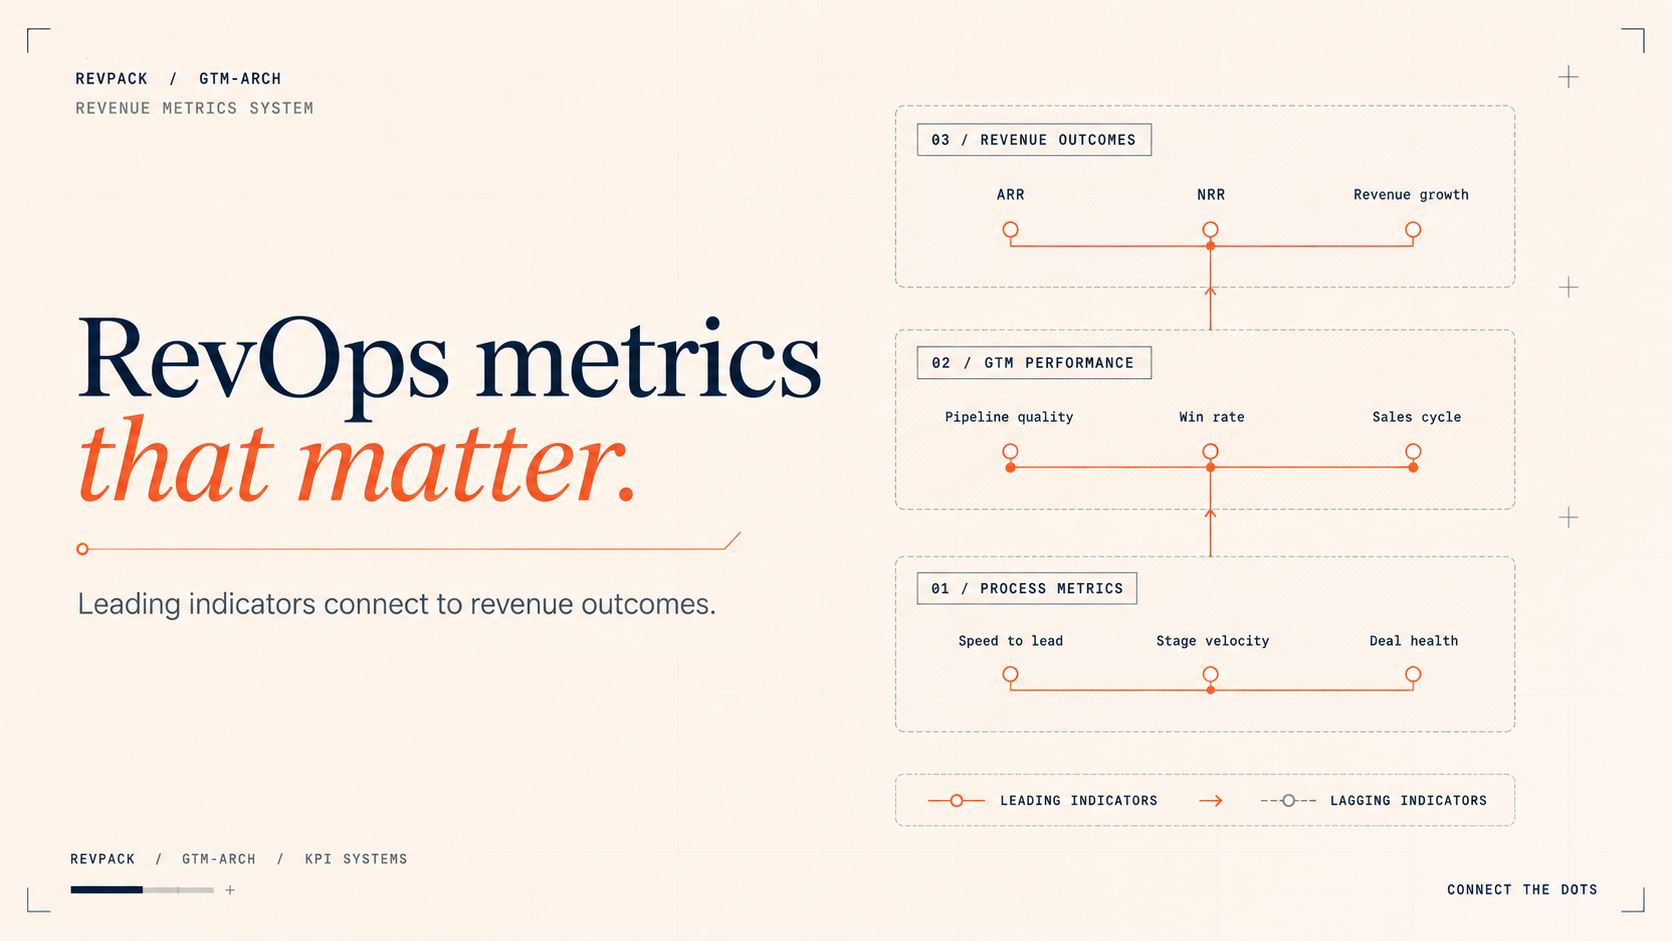
A good RevOps KPI system connects leading indicators, such as speed to lead, stage progression, pipeline quality, and customer engagement, with lagging indicators like ARR, win rate, NRR, CAC, and revenue growth.
Best for
This guide is for B2B SaaS, tech, agency, and RevOps teams that want cleaner reporting, better forecasting, and more useful revenue dashboards.
RevPack angle
RevPack helps B2B teams define RevOps metrics, clean CRM data, connect HubSpot and Salesforce reporting, build dashboards, and track the GTM signals that actually drive pipeline and revenue.
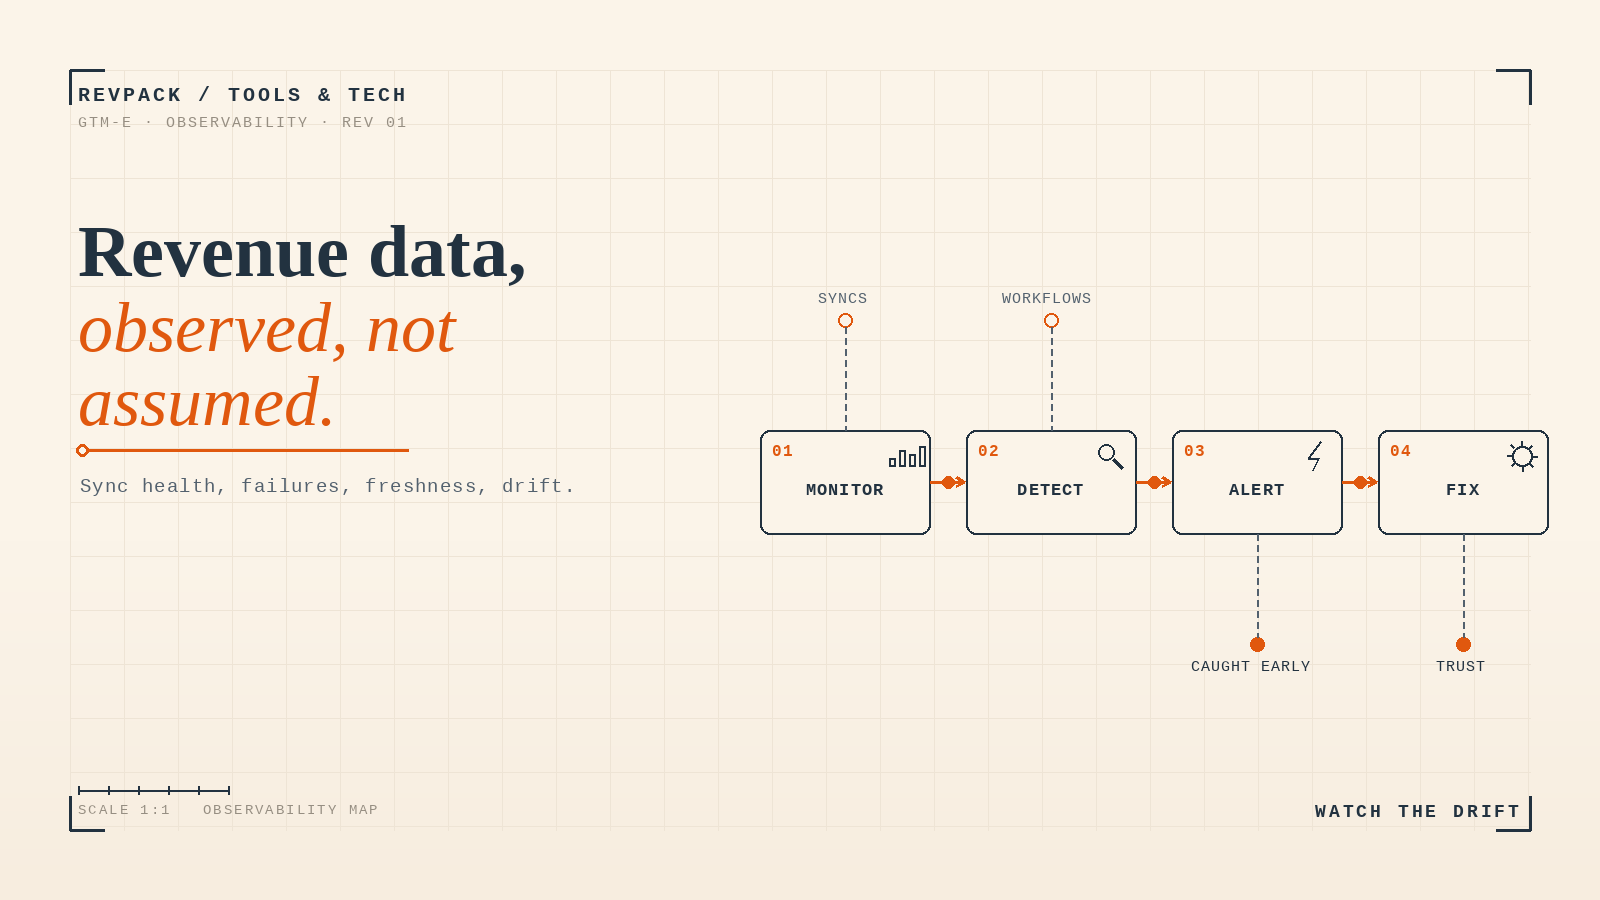
Why most RevOps dashboards do not help
A lot of teams have dashboards.
They track MQLs, pipeline coverage, win rates, sales cycle length, ARR, churn, and forecast.
Then the quarter ends and leadership still asks:
Why did we miss target?
That usually happens because the dashboard shows outcomes, but not the drivers behind those outcomes.
For example:
- Pipeline coverage looked healthy, but the deals were low quality
- MQL volume increased, but lead-to-opportunity conversion dropped
- Sales activity looked high, but response speed was too slow
- Forecast looked strong, but close dates kept slipping
- Customer health looked fine, but expansion signals were missed
A useful RevOps dashboard should help teams understand what is happening before revenue is missed.
What are RevOps metrics?
RevOps metrics are the KPIs used to measure how well your revenue engine works across marketing, sales, customer success, and finance.
Good RevOps metrics answer three questions:
- Are we creating enough pipeline?
- Is the pipeline high quality?
- Are we converting and retaining revenue efficiently?
The mistake is tracking too many disconnected numbers.
The goal is to build a simple metrics hierarchy that links activities to outcomes.
The 3 layers of RevOps metrics
A simple RevOps KPI system has three layers.
1. Revenue outcomes
These are lagging indicators. They show what happened.
Examples:
- New ARR
- Expansion ARR
- Net Revenue Retention
- Gross Revenue Retention
- Customer Acquisition Cost
- CAC payback
- Revenue growth
- Churn
- Closed-won revenue
These metrics matter, but they usually show up too late to fix the quarter.
2. GTM performance metrics
These show how well the revenue engine is working.
Examples:
- Pipeline generated
- Qualified pipeline coverage
- Win rate
- Average deal size
- Sales cycle length
- Marketing-sourced pipeline
- Lead-to-opportunity conversion
- Opportunity-to-close conversion
- Pipeline velocity
These metrics help explain whether your GTM motion is healthy.
3. Process metrics
These are leading indicators. They show what is likely to happen next.
Examples:
- Speed to lead
- Lead response time
- MQL to SQL conversion
- Stage progression velocity
- Demo show rate
- No-next-step opportunities
- Stale pipeline
- Deal health score
- Number of active stakeholders
- Customer product usage
- Expansion signals
These are the metrics that help teams act earlier.
Leading vs lagging indicators
Lagging indicators tell you what already happened.
Leading indicators help you predict what may happen.
You need both.
Metric typeExampleWhat it tells youLagging indicatorARRHow much revenue was createdLagging indicatorWin rateHow many opportunities closedLagging indicatorNRRHow much revenue was retained and expandedLeading indicatorSpeed to leadWhether sales is responding fast enoughLeading indicatorStage progression velocityWhether deals are moving normallyLeading indicatorDeal health scoreWhether pipeline is likely to closeLeading indicatorProduct usageWhether customers may renew or expand
If you only track lagging indicators, you are reporting history.
If you track leading indicators, you can improve performance before the number is missed.
Build one shared KPI language
Most reporting problems start with definitions.
Marketing may define a qualified lead one way.
Sales may define it another way.
Customer success may use a different definition of expansion risk.
That creates confusion.
Start by defining the basics.
Core lifecycle definitions
MetricSimple definitionLeadA new contact or account entered the systemMQLA lead that matches ICP and shows enough intent for sales reviewSALA lead that sales accepts for follow-upSQLA lead that sales has qualified through conversationOpportunityA real deal with a business problem, value, owner, and next stepCustomerA closed-won accountExpansion opportunityAn existing customer account with upsell or cross-sell potential
The names matter less than consistency.
Everyone should use the same rules.
Track pipeline quality, not just pipeline volume
Pipeline volume is useful, but it can be misleading.
A big pipeline does not mean you have a strong quarter.
What matters is qualified pipeline.
A good pipeline quality review looks at:
- Does the account match ICP?
- Is the business problem clear?
- Is the decision-maker involved?
- Is there a next step?
- Is the close date realistic?
- Is there real buyer engagement?
- Is the deal multi-threaded?
- Is there a known budget or business case?
- Has the buyer confirmed the timeline?
A smaller pipeline with strong evidence is usually better than a large pipeline full of weak opportunities.
Pipeline quality metrics to track
Use these metrics to understand whether your pipeline is real.
MetricWhy it mattersQualified pipeline coverageShows whether enough real pipeline existsStage progression velocityShows whether deals are moving or stuckNo-next-step opportunitiesReveals weak deal controlStale opportunity rateShows pipeline that may need cleanupMulti-threaded deal rateShows whether more than one stakeholder is involvedClose date push rateShows forecast riskWin rate by segmentShows where the team performs bestLost reason by segmentShows where qualification or positioning is weak
These metrics help leadership understand the quality behind the forecast.
Track operational efficiency
RevOps should also measure how efficiently the GTM machine runs.
These metrics show bottlenecks.
Sales efficiency metrics
- Revenue per rep
- Pipeline generated per rep
- Meetings booked per rep
- Opportunity conversion rate
- Ramp time for new reps
- Quota attainment by segment
Marketing efficiency metrics
- Cost per qualified lead
- Marketing-sourced pipeline
- Campaign-to-opportunity conversion
- Content-assisted pipeline
- Lead source quality
- MQL-to-SQL conversion
Customer success efficiency metrics
- Revenue per CSM
- Time to value
- Expansion pipeline per CSM
- Renewal risk rate
- Health score accuracy
- Onboarding completion rate
Do not track everything at once.
Pick the metrics that explain your biggest revenue problem right now.
Track Net Revenue Retention properly
Net Revenue Retention is one of the most important RevOps metrics for SaaS companies.
NRR shows how much revenue you keep and expand from existing customers.
Basic formula:
NRR = Starting ARR + Expansion ARR - Contraction ARR - Churned ARR / Starting ARR
Track the pieces separately:
- Starting ARR
- Expansion ARR
- Contraction ARR
- Churned ARR
- Gross Revenue Retention
- Net Revenue Retention
NRR becomes more useful when you break it down by:
- Segment
- Plan
- Industry
- Acquisition source
- Customer success owner
- Use case
- Cohort
- Time to value
This helps you see which customers grow, shrink, or churn.
Customer success metrics that support revenue
Customer success should not only track satisfaction.
It should track revenue signals.
Useful CS metrics include:
- Product usage
- Feature adoption
- Time to value
- Onboarding completion
- Support ticket volume
- Health score
- Renewal risk
- Expansion readiness
- Champion engagement
- Executive sponsor involvement
- QBR participation
These signals help predict renewals, churn, and expansion.
They also help marketing and sales find better-fit customers in the future.
The RevOps KPI dashboard checklist
A useful RevOps dashboard should include four sections.
1. Revenue outcomes
- ARR
- New revenue
- Expansion revenue
- Churn
- NRR
- CAC payback
2. Pipeline health
- Pipeline created
- Qualified pipeline coverage
- Win rate
- Sales cycle length
- Stage progression
- Forecast risk
3. Process health
- Speed to lead
- MQL to SQL conversion
- No-next-step deals
- Stale opportunities
- Close date push rate
- SLA performance
4. Customer health
- Onboarding completion
- Product usage
- Health score
- Renewal risk
- Expansion signals
- NRR by segment
If a dashboard does not help someone make a decision, remove or simplify it.
Common RevOps metrics mistakes
Tracking too many KPIs
More metrics do not mean better visibility.
Too many dashboards create noise.
Measuring volume without quality
MQLs, pipeline, and activities are useful only when they connect to real conversion.
Letting teams define metrics differently
If sales and marketing define qualification differently, the dashboard becomes political.
Ignoring customer success signals
CS data often explains churn, expansion, and ICP quality.
It should feed back into marketing and sales.
Reporting outcomes without showing drivers
Revenue missed is the result.
RevOps needs to show why it happened.
FAQ
What are the most important RevOps metrics?
The most important RevOps metrics are ARR, pipeline coverage, win rate, sales cycle length, CAC, CAC payback, NRR, speed to lead, MQL-to-SQL conversion, stage progression velocity, and pipeline quality.
What is the difference between leading and lagging indicators?
Lagging indicators show what already happened, such as revenue, churn, or win rate. Leading indicators show what is likely to happen, such as speed to lead, deal health, product usage, or stage progression.
Why is pipeline quality more important than pipeline volume?
Pipeline volume can look healthy even when deals are weak. Pipeline quality shows whether opportunities are real, qualified, engaged, and likely to close.
How should RevOps measure customer success?
RevOps should measure customer success through NRR, GRR, churn, expansion ARR, time to value, product usage, onboarding completion, health score, renewal risk, and expansion readiness.
What should a RevOps dashboard include?
A RevOps dashboard should include revenue outcomes, pipeline health, process health, and customer health. The best dashboards connect leading indicators to revenue outcomes.
How can RevPack help?
RevPack helps B2B teams define KPI schemas, clean CRM data, connect HubSpot and Salesforce reporting, build RevOps dashboards, and track the metrics that drive pipeline, retention, and revenue.
- BoostUp.ai — "2024 RevOps Trends Report," 2024
- Cognism — "Expert Guide to RevOps Metrics," 2024
- Default — "RevOps KPI Metrics," 2024
- Default — "RevOps ROI Measurement," 2024
- INSIDEA — "RevOps KPIs and Metrics," 2024
- QuotaPath — "RevOps Metrics Guide," 2025
- Revenue Operations Alliance — "RevOps Metrics Guide," 2023
- 89% of RevOps professionals define measuring metrics as core to their role, requiring unified KPI schemas across GTM teams
- Quality pipeline metrics outperform volume metrics for revenue prediction, with 3-4x pipeline coverage as healthy target
- Efficiency metrics expose bottlenecks where improving forecasting accuracy is a top RevOps initiative
- NRR serves as north star metric for customer health, driving predictable expansion revenue growth