How do you build a RevOps insights engine your team trusts?
TL;DR
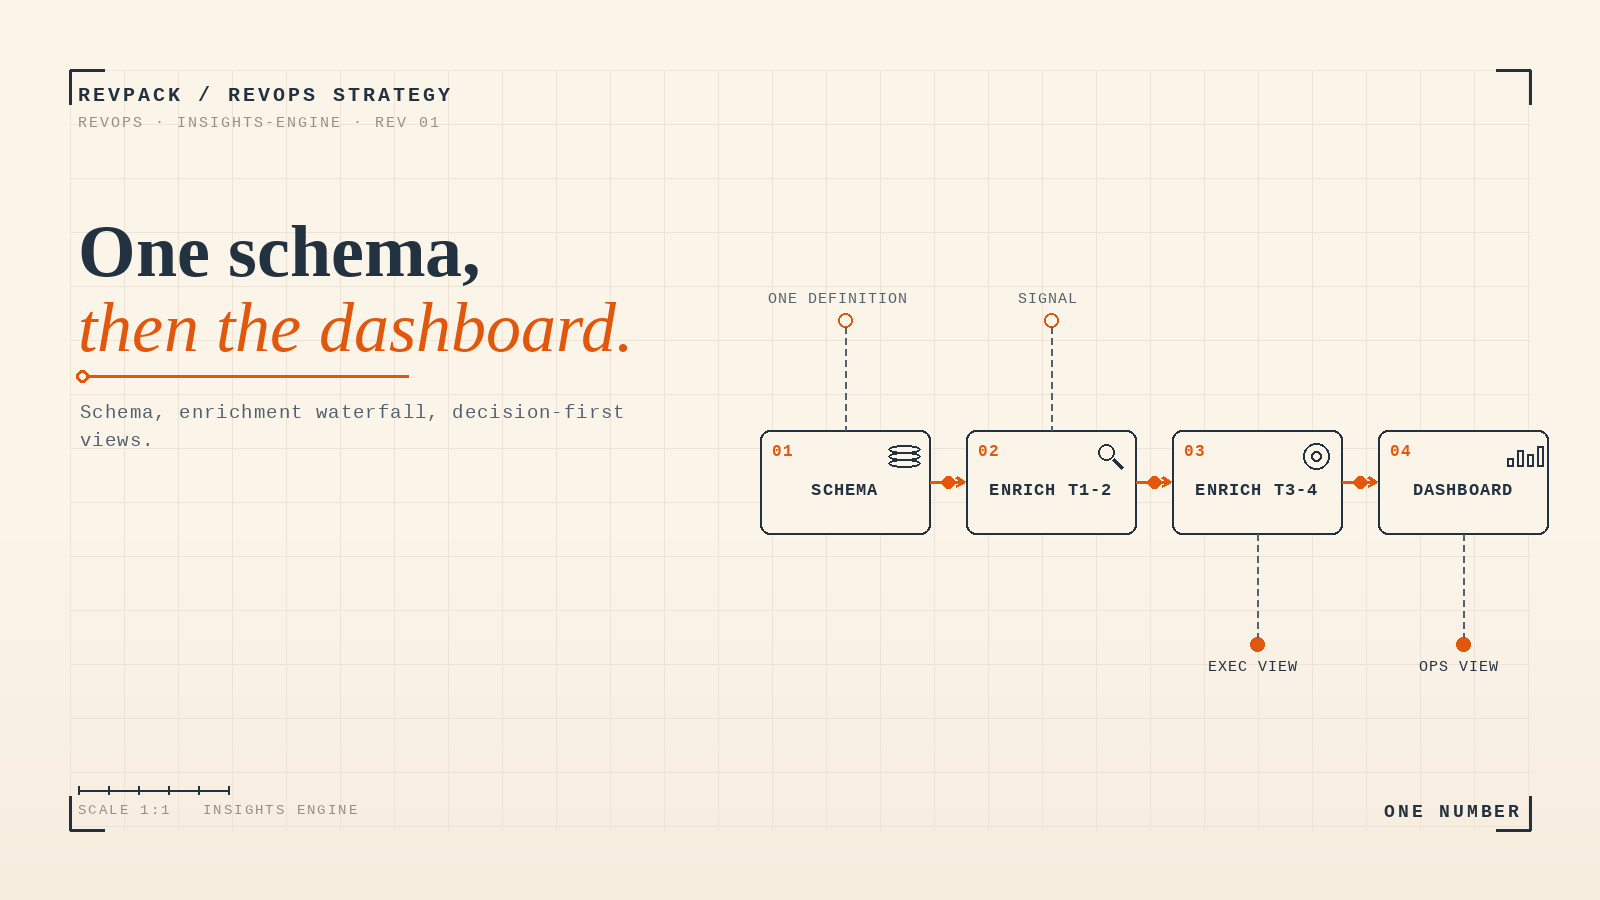
A RevOps insights engine isn't a BI tool. It's three layers under the dashboard: one canonical schema so every team defines objects the same way, a tiered enrichment waterfall so records are complete without overspending, and dashboards built around decisions instead of vanity metrics. Build them in that order. A dashboard on top of conflicting definitions just lets people argue faster.
If marketing says 1,200 and sales says 950, you have a schema problem
Two teams walk into a pipeline review. Marketing reports 1,200 new leads. Sales sees 950 in the pipeline. Both are looking at the same CRM. Both are right, because they're counting different objects with different definitions of "lead." No dashboard reconciles that. The disagreement is upstream, in the data model.
This is the everyday face of a bigger issue. Validity's 2025 survey found 76% of organizations say less than half their CRM data is accurate and complete, and 37% have lost revenue because of it. You can't build trustworthy insight on that. The engine has to fix the data before it visualizes it.
Layer 1: one schema, one definition
The foundation is a single schema: one canonical definition for each object and each field, enforced across every system that writes to the CRM. "Lead," "MQL," "opportunity," "closed-won" each mean exactly one thing, and the systems that create them follow the same rules.
This is unglamorous and it's the whole game. Audit what each system writes, map it to one model, then enforce that model with validation and governance so it doesn't drift back. When the definitions agree, the pipeline-review argument disappears, because there's only one number.
Layer 2: the enrichment waterfall
Once the schema is clean, fill it efficiently. An enrichment waterfall pulls data in tiers, cheap and broad first, expensive and deep only where it's earned. You don't pay for premium intent data on a contact who downloaded one PDF and vanished.
The trigger logic matters as much as the tiers. New records get Tier 1–2 automatically. A demo request or pricing-page visit promotes a contact to Tier 3. A deal crossing a value threshold earns Tier 4 custom research. Spend follows signal.
Layer 3: dashboards built around decisions
Most dashboards track metrics nobody acts on. A useful one starts from a decision: what will someone do differently based on this number? If the honest answer is nothing, cut it.
Build three layers of view, each tied to a job. Executives need revenue health and where the forecast is at risk. GTM leaders need engine performance — conversion by stage, velocity, where deals stall. Operators need the system-level view — sync health, data quality, where the pipeline leaks. Each chart answers a question someone is actually asking.
What to do this week
Open your most-viewed dashboard and pick the top metric. Ask the person who looks at it most: what decision did this number change in the last month? If they can't name one, you've found vanity dressed as insight. Replace it with the number behind a decision they actually make — then check that sales and marketing define it the same way.
Frequently asked questions
Why do sales and marketing report different numbers? They're usually counting different objects with different definitions of the same term. The fix is a single schema — one enforced definition per object and field — not another reconciled report.
What is an enrichment waterfall? A tiered approach to filling records: cheap, broad enrichment for everyone, with premium data triggered only by qualifying signals like a demo request or deal value. It keeps records complete without overspending.
How do I know if a dashboard metric is worth keeping? Ask what decision it changes. If no one can name a recent decision the number drove, it's a vanity metric. Keep the ones tied to actions.
How RevPack helps
We build the layers under the dashboard: a single schema enforced across your stack, a tiered enrichment waterfall wired to real buying signals, and decision-first reporting. If your team spends pipeline reviews arguing about whose number is right, the fix is the engine, not another chart.
- Validity — "The State of CRM Data Management in 2025" (76% say under half their CRM data is accurate and complete). validity.com
- Clay — "Go-to-market with unique data" (waterfall enrichment). clay.com


